Details
- Category: Web design / Data
- Client: FreeCodeCamp
- Date: 04 October, 2022
Description
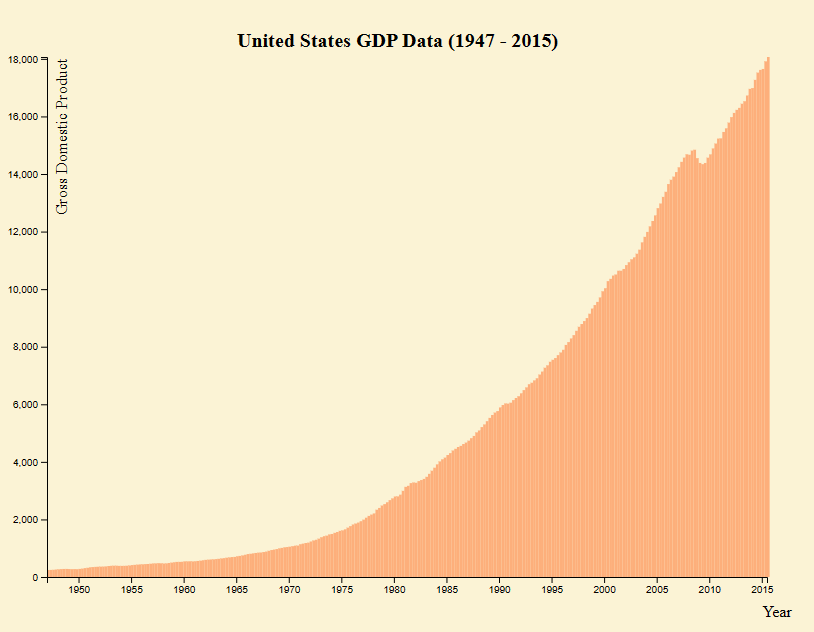
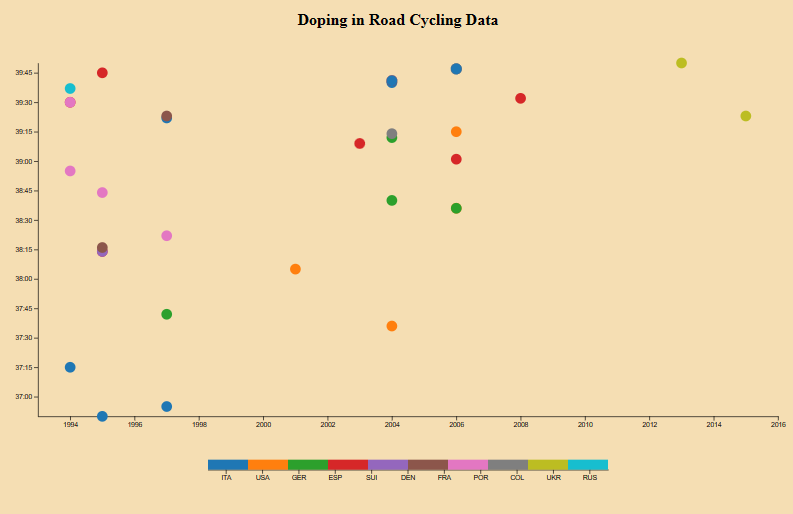
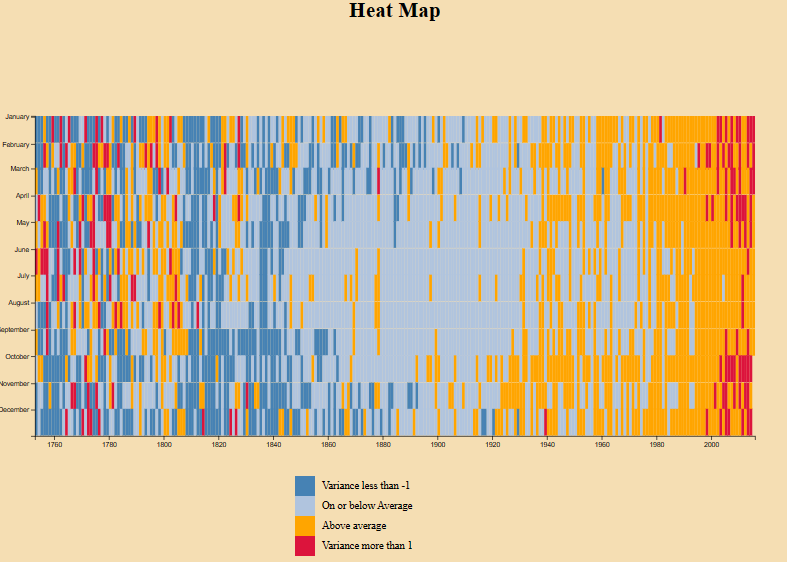
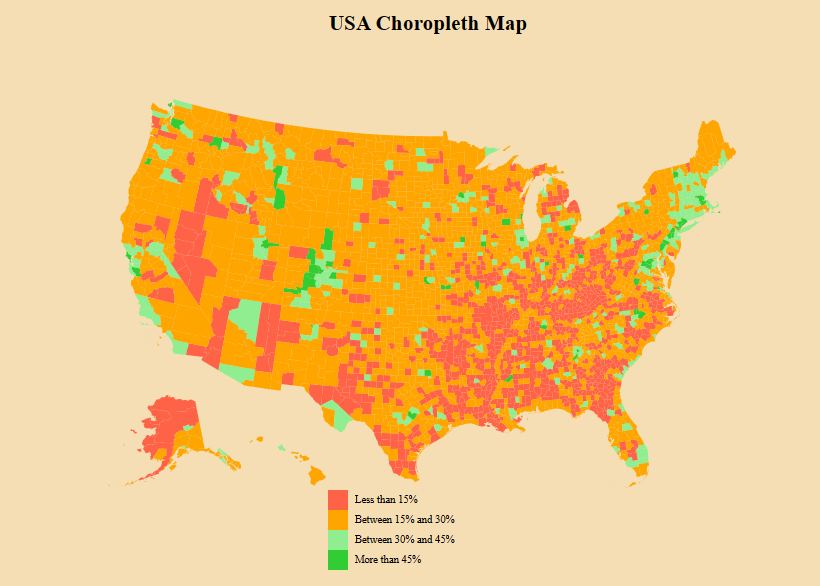
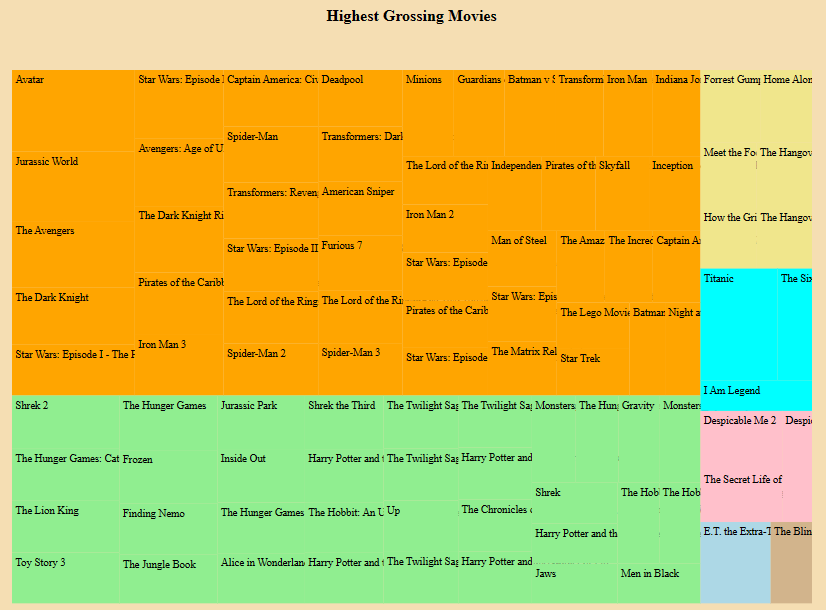
Data is all around us, but it doesn't mean much without shape or context. In the Data Visualization Certification, I built charts, graphs, and maps to present different types of data with the D3.js library. I also learnt about JSON (JavaScript Object Notation), and how to work with data online using an API (Application Programming Interface).
Links
Below consists of the individually deployed sub project links for the certification